
ranks
7
25
for green cover compared to similar places across Australia
Australian Capital Territory is
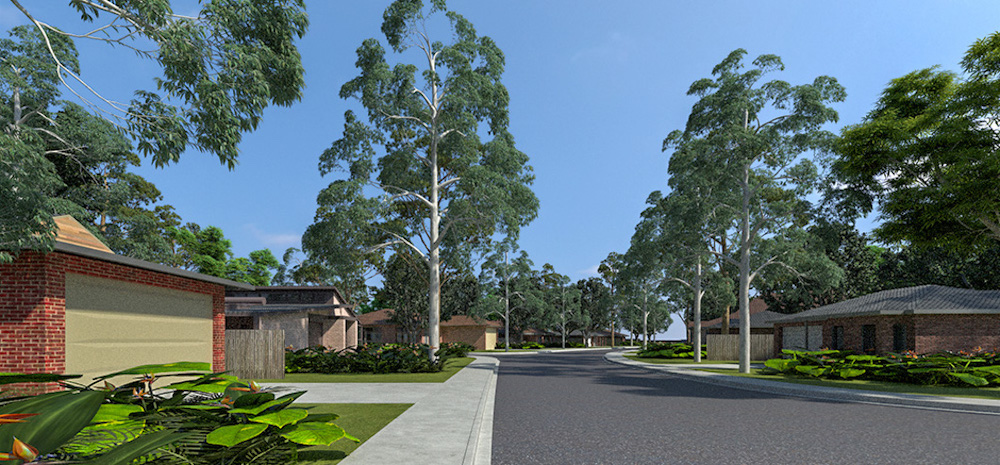
Suburban, spacious and average-high rainfall
<50% urban

Low density
Ave to high rainfall
vital statistics
426,704
population
LOW
HIGH
1.6%
population growth (ave annual % change over past 20 years)
LOW
HIGH
181
population density
(people per sq km)
LOW
HIGH
15.8%
proportion of LGA that is urban
LOW
HIGH
13.8%
proportion apartments
LOW
HIGH
1,089
measure of advantage and disadvantage
(SEIFA-IRSAD)
LOW
HIGH
31.2%
parents born overseas
LOW
HIGH
838.7
rainfall
(annual ave mm)
LOW
HIGH
7.3%
bushfire affected
(% of LGA area burnt last 5 years)
LOW
HIGH
ACT has
54.7%
canopy
(typically over 3m)
 Up 9.1%
since 2016
Up 9.1%
since 2016

12.7%
shrub
(typically below 3m)
Up 8.2%
since 2016

26.7%
grass
and bare ground
 Down -15.8%
since 2016
Down -15.8%
since 2016
Your green cover
Your green space

5.9%
grey
(hard surface, e.g. pavement, roads and roofs)
 Down -1.5%
since 2016
Down -1.5%
since 2016
54.7%
canopy
(over 3m)
Up 9.1%
since 2016
12.7%
shrub
(over 3m)
Up 8.2%
since 2016
26.7%
grass
(over 3m)
Down -15.8%
since 2016
5.9%
grey
(hard surface, e.g. pavement, roads and roofs)
Down -1.5%
since 2016
Your green cover
Your green space

SHADE & COOLING

PLACES TO RIDE & RUN

WILDLIFE HABITAT

AESTHETICS & VALUE
green cover is important
While grass is great for recreation, green cover is what creates many of the other big benefits, like keeping suburbs and homes cool and giving shade for walking, running and active transport.
It also brings wildlife into suburbs and makes them more appealing to the eye which, in turn, can make them more valuable.
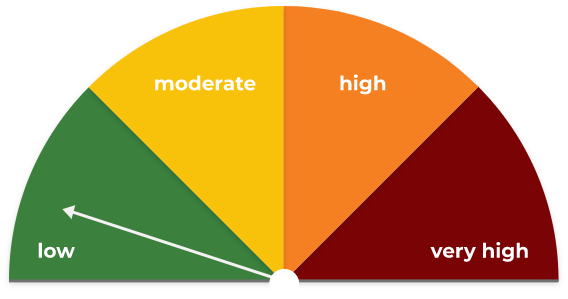
When it comes to green cover
ACT
ranks
7
25
for green cover compared to similar places across Australia
with
with
67.4%
green cover
ACT
is here
75%+
50-75%
25-50%
0-25%
75%+

ACT
is here
50-75%

ACT
is here
25-50%

ACT
is here
0-25%

ACT
is here
SLIDE THE SLIDER
to see how green changes a street in a place like yours


ACT's
GREEN COVER
has
INCREASED
17.3%
since 2016
is
moderately above
comparable places
This means there is a
Lower
challenge rating for ACT in maintaining and growing future green cover
This information is based in its entirety on: Hurley, J., Amati, M., Deilami, K., Caffin, M., Stanford, H., Azizmohammad, S. (2020) Where will all the trees be? - an assessment of urban forest cover and management for Australian cities, prepared for Hort Innovation by the Centre for Urban Research, RMIT University, Melbourne and Greener Spaces Better Places.
BE INSPIRED.
The latest green space news, in your inbox monthly